Macro Kernel - 1st June
Japan Inc's First Quarter

Notable Today
It’s a busy calendar, but although it produced neither shocks nor surprises, possibly the most significant release of the day came from Japan, where the MOF published the results of its quarterly survey of private sector balance sheets and p&ls. It is a truly monstrous undertaking, tracking 3.788mn Japanese companies of all sizes (up 5% yoy), which allows us to get a idea of what went on in Japan Inc during 1Q.
Headline numbers: sales up 5% yoy and operating profits up 7.1%; total assets up 5.3% yoy and shareholders’ equity up 6.9%. That results in annualized ROA rising to 3.79% from 3.74% in 1Q22, but ROE slipping to annualized 9.3% (vs 9.4% in 1Q22).
Decomposing that ROE (thanks to Mr Dupont):
Operating Margins in 1Q rose to 4.88% (vs 4.78% in 1Q22);
Asset Turns in 1Q was unchanged yoy at an annualized 0.78x
Financial Leverage in 1Q fell to 2.47x (vs 2.50x in 1Q22). Net debt/equity dipped to 46.8% (vs 47.1% in 1Q22)
In other words, this was practically another quarter of steady-state for Japan Inc: what good was being down was attributable to rising margins.
Breaking down those margins:
Cost of goods sold fell 0.4pps yoy to 75.9% of sales
But this good news was offset by SG&A rising 0.3pps to 19.2% of sales. This deterioration looks like rise in admin and directors’ expenses, since personnel expenses as % sales fell 0.2pps to 11.8%.
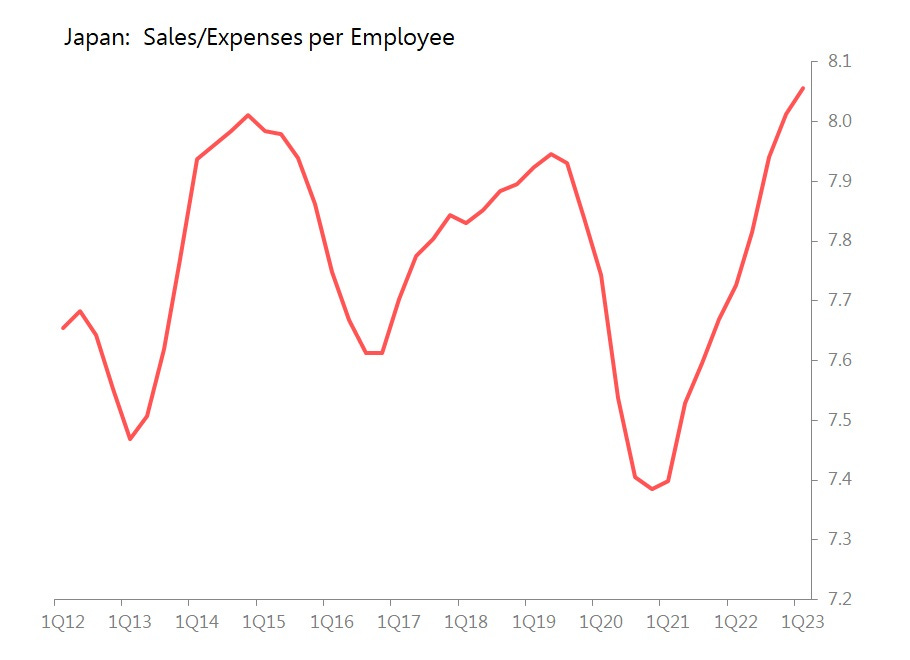
As for corporate tactics and strategy, two things stand out. First, management is working its workforce harder, with sales per employee rising 6.8% yoy but expenses per employee rising only 2.4%. The result is the highest employee sales/expenses ratio since 2010 at 8.06x.
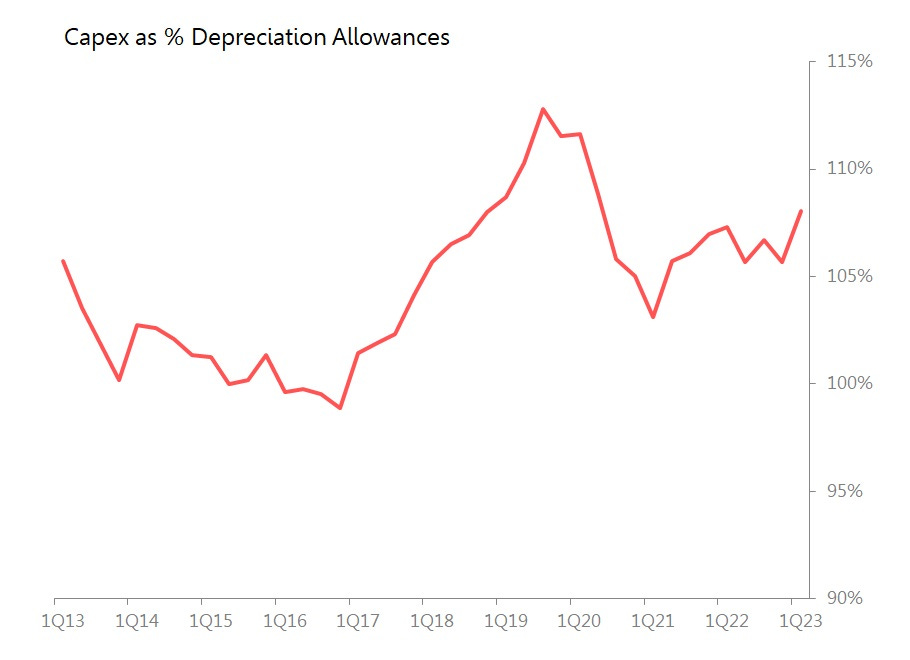
Second, with capex rising 11.4% yoy whilst depreciation allowance rose only 4.2%, it is just imaginable that corporate Japan is toying with the idea of investing more than is required to offset depreciation.
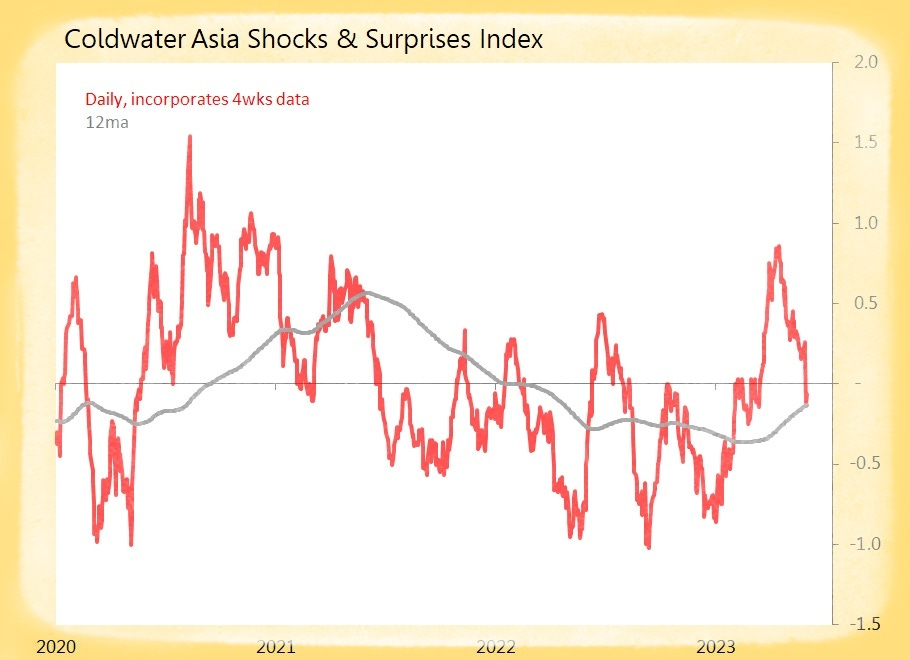
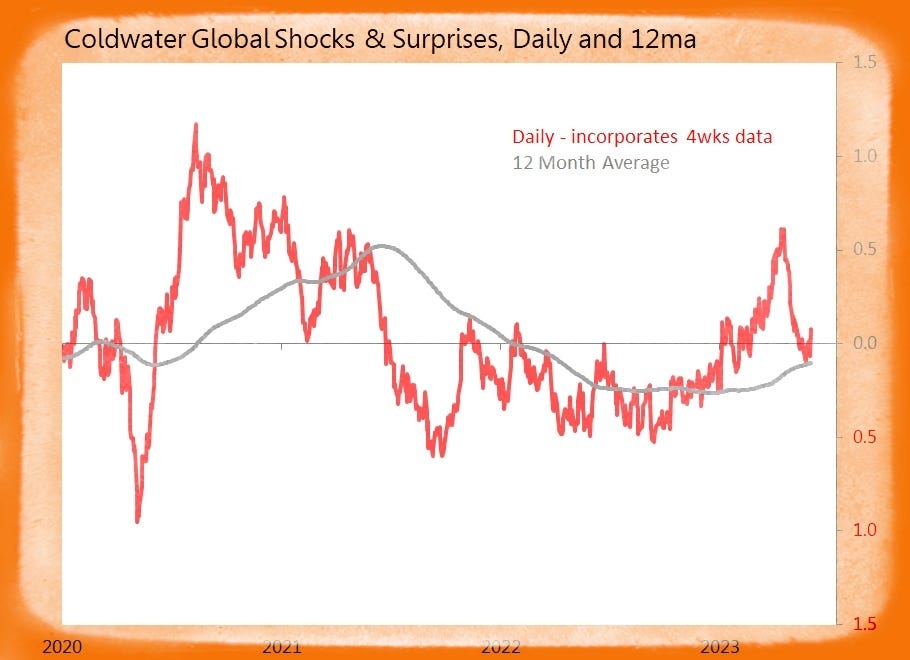
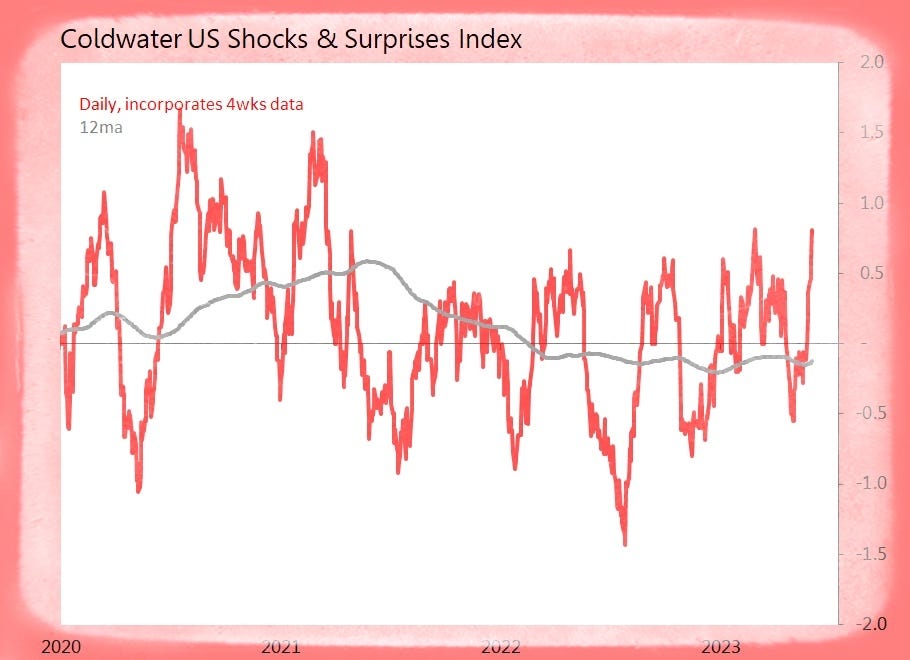
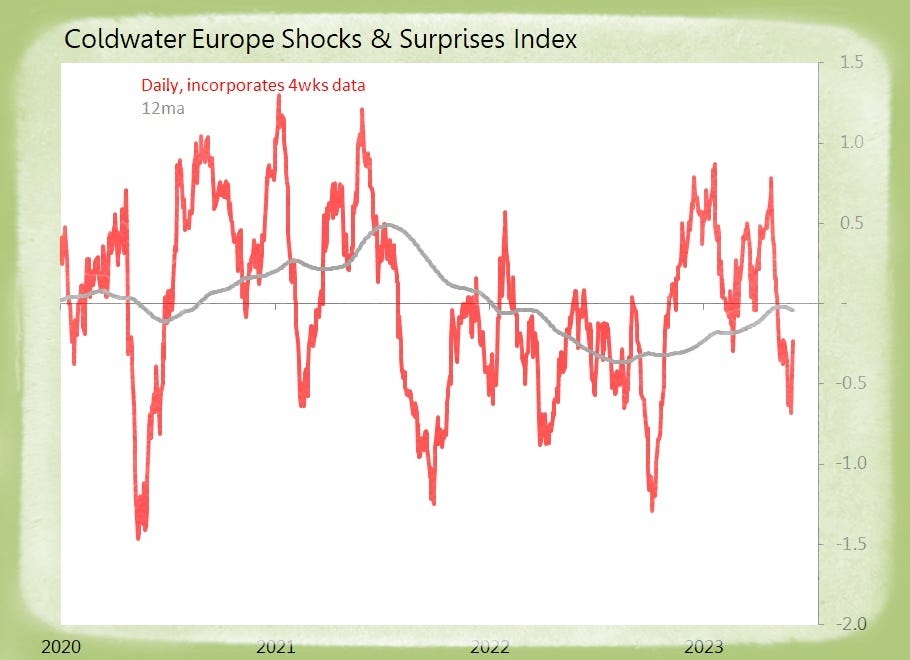
Summary: 39 data releases tracked today, generating nine surprises and only three shocks. The result is that the global index is now back in positive territory. The US’s results were solidly on the ‘surprising’ side, pushing its index back to heights last seen in February, and before that in early 2021.
US (10 tracked)
Surprise! ADP May Private Payrolls Jump 278k
o Drivers: Leisure & Hospitality +208k, Mining & Natural Resources +94k, Construction +64k
o Drags: Manufacturing Down 48k, Finance Down 35k, Education & Health Down 29k
o Demographics: Small Cos +2235k, Medium-Sized +140k, Large Cos Down 106k
Surprise! May ISM Manufacturing Prices Paid Drop 9pts to 44.2
o Lowest Since May 2020
o 85% Report Paying ‘Same’ or ‘Less’, vs 74% in April
o Of 15 Sectors, 10 Report Paying Less: Wood Products, Primary Metals, Paper Products
o Three of Top 6 Sectors Report Paying More: Machinery, Petroleum & Coal Products, Transport Equipt
Surprise! April Construction Spending Rises 1.2% mom and +6.1% yoy
o Private Construction +1.3% mom, Public +1.1%
o Residential +0.4% mom, Non-Residential +1.9%
o Drivers: Manufacturing +8.6% mom, Highway & Street +1.2%, Lodging +2.6%
o Drags: Power Down 1% mom, Sewage & Waste Down 1.9^, Education Down 0.1%
Surprise! 1Q Labour Productivity final Falls 2.1% qoq Only
o Output +0.5% qoq, and Hours Worked +2.6%
o Manufacturing Productivity Down 2.5% qoq, with Durables Down 5.6%, Non-Durables +1.3%
o Non-Financial Corporate Productivity Down 4.3% qoq
Surprise! 1Q Unit Labour Costs final Rise +4.2% qoq Only
o Output +0.5% qoq, Hours Worked +2.6%, Hourly Compensation +2.1%, Real Hourly Compensation Down 1.7%
o Non-Labour Unit Costs +5.2% qoq
o Manufacturing ULCs +3.1% qoq, with Durables +4.7%, Non-Durables +2.2%
o Non-Financial Corporate ULCs +6.8% qoq
Europe (15 tracked)
Surprise! Eurozone May CPI flash Rises +6.1% yoy Only
o Monthly Rise of 0.1% mom is 1.2SDs Below Historic Seasonal Trends
o Energy Down 1.7% yoy, but F&BT +12.5% yoy
o Non-Energy Industrial Products +5.8% yoy, Services +5%
o Germany +6.3% yoy, France +6%, Italy +8.1%, Spain +2.9%
Surprise! Eurozone May Core CPI flash Rises +5.3% yoy Only
o Monthly Rise of 0.2% mom is 0.3SDs Below Historic Seasonal Trends
Asia (14 tracked)
Surprise! China May Caixin Manufacturing PMI Rises 1.4pts to 50.9
o New Orders Rise 2nd-Quickest in 2yrs, with Export Orders Slightly Better
o Output Rises Most since June 2022, Backlogs Fall First Time in 5m, Inventories Fall Slightly
o Sentiment Sinks to 7m low, Payrolls Fall Most Since Feb 2020
o Input and Output Prices both Fall Solidly
Shock! Taiwan May Markit Manufacturing PMI Drops 2.8pts to 44.3
o Worst Since Jan
o New Orders Fall Most Since Jan, with Export Orders Fall Accelerating
o Output Falls Most in 4m, but Backlogs and Finished Inventories both Falling Sharply
o Firms Mildly Optimistic, but Payrolls Fall for 5th Month, and Most in c3yrs
o Input Price Fall First Time in 6m, Selling Prices Fall Solidly
Shock! Thailand May Markit Manufacturing PMI Falls 2.2pts to 58.2
o Still V Vigorous Expansion
o New Orders Rise 2nd Fastest on Record, with Export Orders Best Since July 2021
o Output Rises 2nd Fastest on Record, but Backlogs & Finished Inventories both Rise
o Sentiment Positive for 21st Month, and Payrolls Rise for 2nd Month
o Input Inflation Lowest Since Aug 2021, Output Prices Rise Least in 19m
Shock! Australia May A$ Commodity Price Index Drops 17.5% yoy
o Monthly Fall of 6.8% mom is 2.2Sds Below Historic Seasonal Trends
o Rural Commodities Down 3% mom and Down 21.9% yoy; Non-Rural Down 7.1% mom and Down 17.1%
o Base Metals Down 4.4% mom and Down 12.9%yoy
o Bulk Commodities Down 8.6% mom and Down 22.4% yoy
Surprise! Australia 1Q Private Sector Capex Volume Rises +2.4% qoq and +6.3% yoy
o Buildings & Structures +1.3% qoq, Plant & Equipt +3.7%
o Mining +1.87% qoq, Non-Mining +2.7%
o Drivers: Manufacturing +8.9% qoq, Admin & Support +12.3%, Transport & Postal +7.1%
o Drags: Construction Down 19.1% qoq, Prof/Sci/Tech Down 6.3%, Finance & Insurance Down 3.7%