Macro Kernel - 14th April
US CPI/PPI terms of trade; OECD oil inventory cover

Notable Today
The second of the familiar three-card inflationary trick initiated by a large rise in energy prices (1. Energy prices; 2. Prices of Everything Else Catching Up; 3. Catch-up Wage Pressure) is almost played out in the US. That, at least, is one lesson we can take from the combination of yesterday’s CPI (up 0.1% mom). and today’s Final Demand PPI (down 0.5% mom sa).
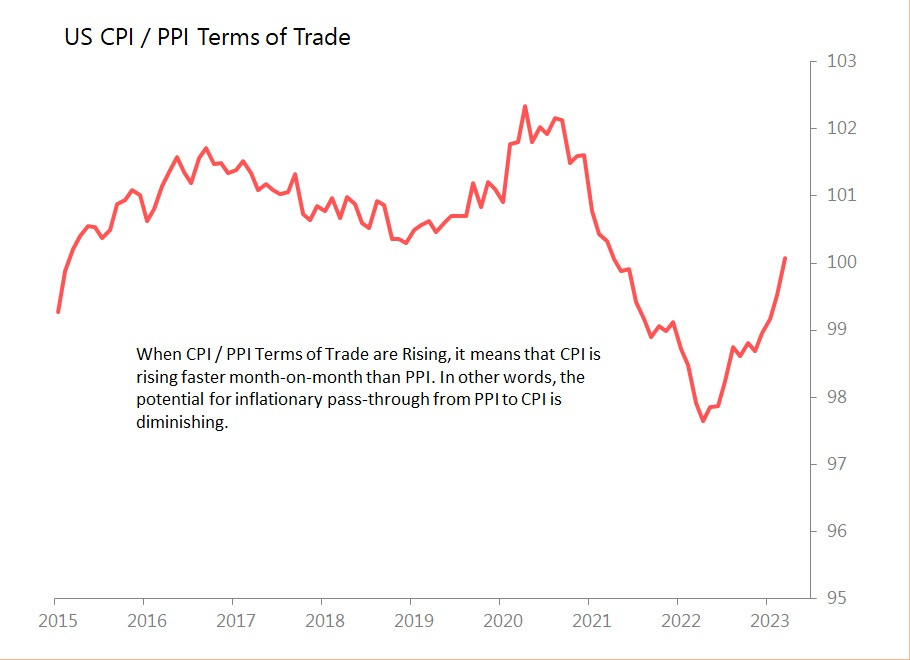
During the initial onset of inflationary pressures, the CPI/PPI terms of trade fell dramatically, implying a new pressure on consumer margins. Since the middle of last year, the story of inflation has been that of prices rising in order to recapture lost margins. We can measure this by looking at the CPI/PPI terms of trade.
As the chart shows, those terms of trade soared mightily during the pandemic before collapsing in the face of energy prices. However, they have now recovered to within touching distance of pre-covid levels. Consequently, we can expect price/price inflation pressures to ease from here. The prospect of actual deflation in 2024 remains.
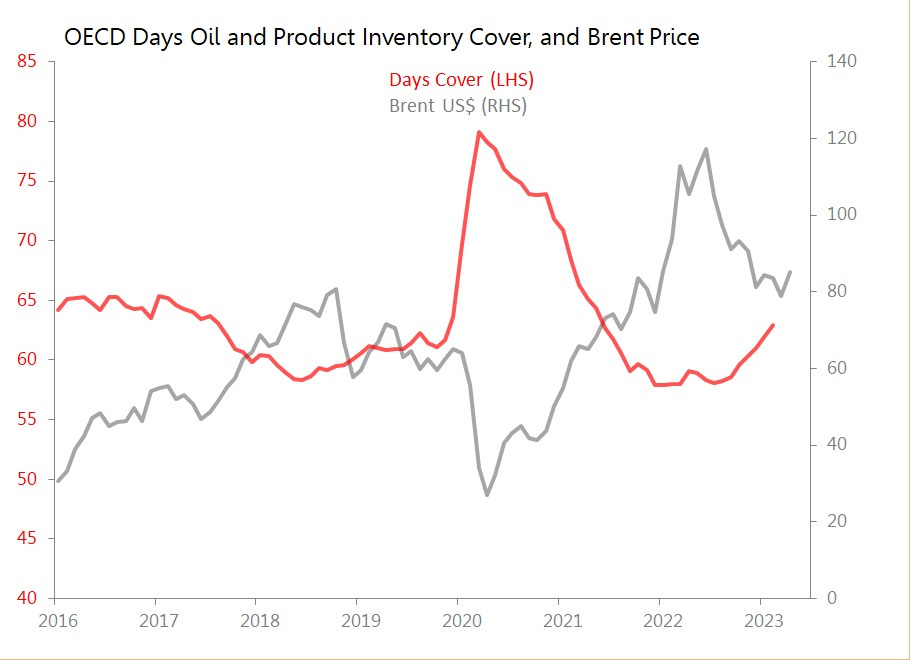
In a closely neighbouring part of the forest, OPEC’s April oil market report gives the background to this month’s decision to cut production. OECE inventory cover for crude and products rose by a full day in February to 62.9 days. If we exclude the anomalous demand-collapse pandemic days, that’s the highest cover since 2017.
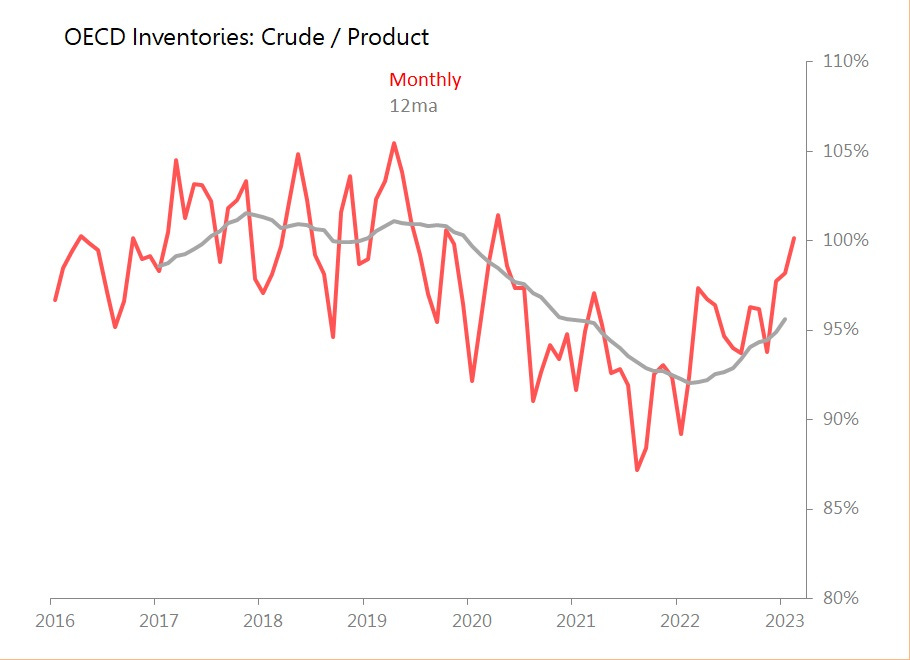
And it’s crude inventories which are mounting: up 13/.6% yoy, whilst product inventories are up only 4.8% yoy. The ratio between crude and product inventories is now tilted towards crude to the highest extent since pre-pandemic days.
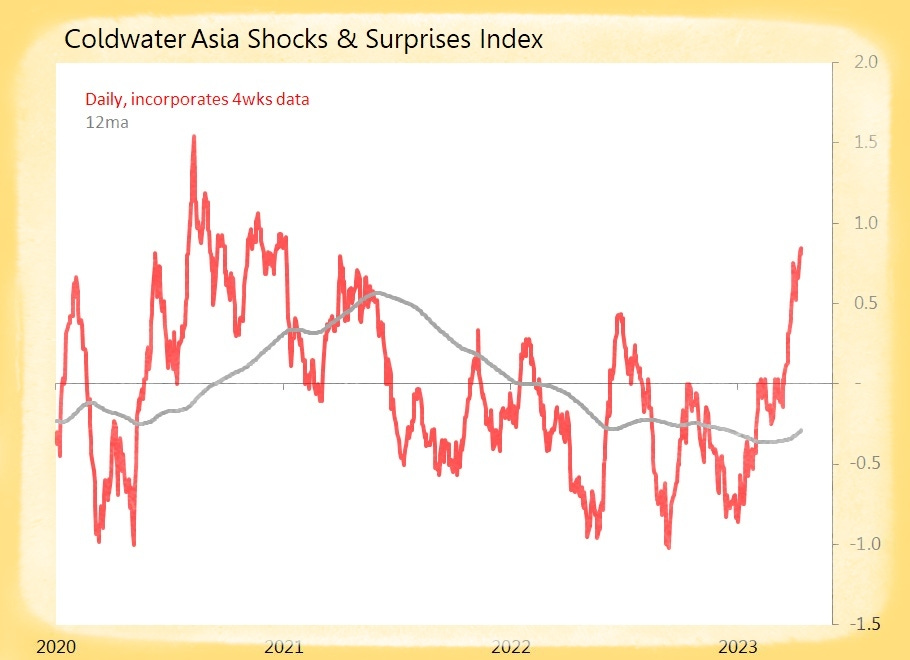
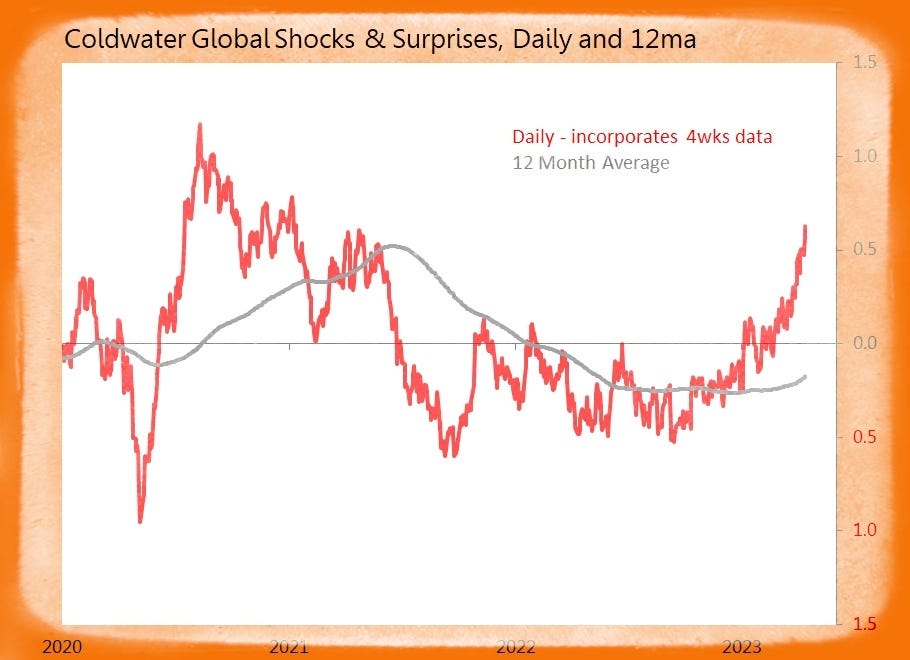
Summary: 24 data releases tracked today, generating seven surprises and only three shocks. The global index is now soaring, and even if you exclude all the recent encouraging inflation news, it is now at its strongest since May 2022.
US (6 tracked)
Surprise! March PPI Final Demand Falls Down 0.5% mom sa
o Unadjusted PPI +2.7% yoy, with a Monthly Movt 2.2SDs Below Historic Seasonal Trends
o Energy Prices Down 6.4% mom and Food +0.6% mom
o Goods ex-Food & Energy +0.3% mom
o Final Demand Services Down 0.3% mom, with Transport & Warehousing Down 1.3% mom, Trade Services Down 0.9% and Others +0.1%
Surprise! PPI ex-Food & Energy Falls 0.1% mom sa
o Unadjusted PPI ex-Food & Energy +3.4% yoy, with Monthly Movt 0.9SDs Below Historic Seasonal Trends
Shock! Weekly Initial Jobless Claims Rise 11k to 239k
o Largest Rises: Indiana +4.5k, Illinois +1.9k, Massachusetts +1.2k
o Largest Falls: California Down 6.8k, Kentucky Down 3.9k, Michigan Down 3.3k
Surprise! Global OECD Oil & Product Inventories Rise 1 Day to 62.9 Days
o Total Inventories up 0.5% mom and +9.1% yoy
o Crude Inventories +1.5% mom and +13.6% yoy
o Product Inventories Down 0.5% mom and +4.8% yoy
Europe (9 tracked)
Surprise! Eurozone Feb Industrial Production Gains +1.5% mom
o Manufacturing +1.3% mom, Energy & Utilities +1.4%
o Germany +2.1% mom, France +1.1%, Spain +0.6%, but Italy Down 0.2%
Shock! UK Feb Industrial Production Falls 0.2% mom
o Electricity/Gas Down 2.2%, Water Utilities Down 1.3%, but Mining/Quarrying +3%
o Manufacturing Unchanged, with Consumer Durables +4.2%, Capital Goods +1%
o Consumer Non-Durables Down 1.1% mom and Intermediates Unchanged
o Largest Driver: Computer & Electronics +2.9% mom
o Largest Drag: Chemicals Down 0.5% mom
Surprise! UK Feb Construction Volume Rises +2.4% mom
o New Work +1% mom, Repair/Maintenance +4.7%
o Housing +2% mom, with Public Sector +1.3%, Private +2%
o Private Industry +1.8% mom, Private Commercial +1.7%, but Infrastructure Down 1.5%
Surprise! UK Feb 3m Trade Deficit of £15.24, Smaller Than Expected
o Feb’s Exports Down 2.7% mom, Imports Down 0.8%
o Usual Major Revisions: Instability of Series Makes Further Analysis Pointless
Asia (9 tracked)
Surprise! China March Exports Rise +14.8% yoy
o Largest Markets: Asean 17.9% of Total, EU 14.5%, US 13.8%, Hong Kong 8.3%
Shock! China March Imports Fall 1.4% yoy
o Largest Suppliers: Asean 14.6% ot Total, EU 11.1%, Taiwan 7.4%, US 7.1%
o Strong Commodity Volumes: Coal +151% yoy, Refined Oil +110.5%, Crude +22.5%
o Weak Commodity Volumes: Steel Down 32.5% yoy, Primary Plastics Down 14%, Copper Ore Down 7.5%