Macro Kernel - 10th May

Notable Today
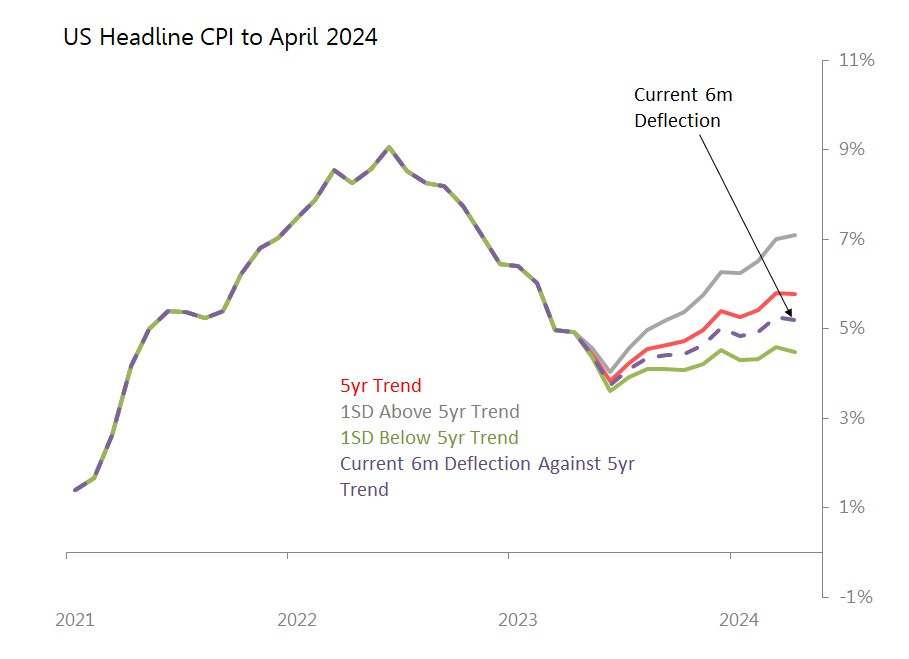
By July we’ll have the first real indication of the degree to which this year’s retreat in US is the real thing, or is mainly just responding to increasingly favourable bases of comparison. For almost all trajectories based on monthly deflections from 5yr seasonalized trends, year-on-year CPI bottoms in June, and starts to rise once again in July. This is true even if monthly deflections are a full standard deviation below trend., with July’s CPI likely to show 3.9% (1SD below trend) to 4.2|% (on-trend) to 4.6% (1SDs above trend).
April’s 0.4% mom rise, which generated a headline rate of 4.93% yoy, was the result of a monthly move 0.1SD above historic seasonal trend. In other words, at the moment, historic trends are merely reasserting themselves. This is not enough to bring inflation back to c2% anytime soon.
As the chart shows, unless there is a complete and disinflationary break from the trends of the last five years, the second half of the year will see a reacceleration of headline yoy inflation.
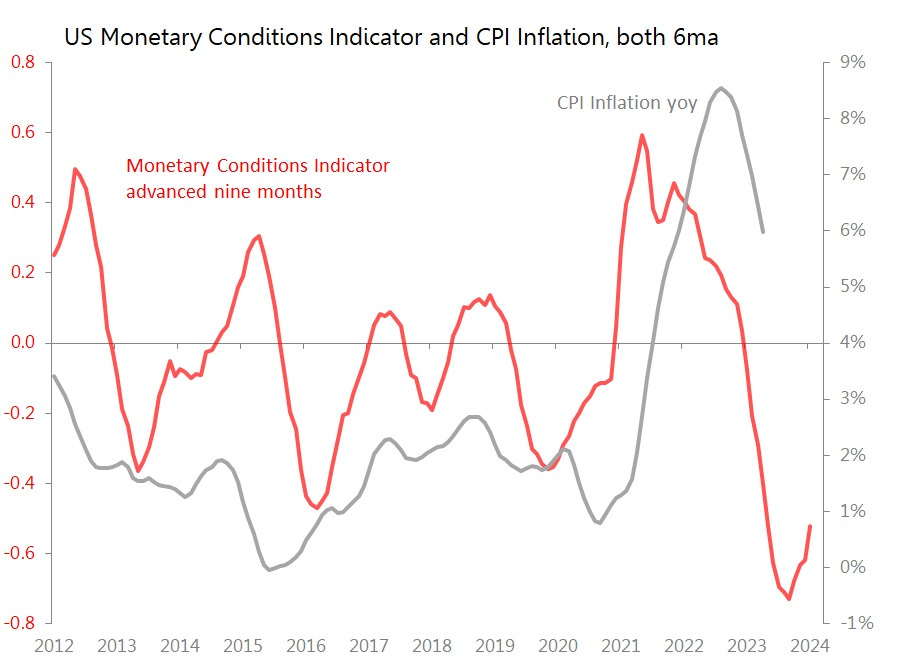
But we might well see, eventually, a complete breakdown of previous inflationary trends. Those trends could be broken by the severe and sustained tightening of monetary conditions seen continuously since March 2022. The latest twist in that tightening is no longer being dictated by the FOMC, but rather by the contraction in credit dictated by the nervousness of US depositors.
The chart below suggests we should expect this tightening to tame inflation - indeed, quite possibly to generate deflation. However, what is equally clear is that there is no reliable guide to how long it takes. In the chart, I have advanced the monetary conditions indicator by nine months, but the earlier history suggests this is too much, and the more recent history suggests it is too little.
Even though we don’t know exactly when the response to the monetary tightening will start to break the current inflationary trends, I am confident that the response will be visible by 2024. But possibly not before then.
Contradictory expectations? Certainly. Plenty of room for error for policymakers, for investors, and for me.
Summary: A slow day, with only 15 datapoints tracked, generating just one surprise, one shock.
US (3 tracked)
None - Today’s Data Stays Within Range
Europe (2 tracked)
Shock! Italy March Industrial Production Falls 0.6% mom and Down 3.2% yoy
o Consumer Goods Down 1.4% mom, with Durables +0.6%, Non-Durables Down 1.9%
o Capital Goods +0.7% mom, Intermediates Down 0.4%, Energy Down 1.4%
o Drivers: Transport Equipt +12.4%, Pharma +6.5%, Coke & Refinery +3.3%
o Drags: Wood & Paper Down 13.4%, Electricity & Utilities Down 12.5%, Mining Down 11%
Asia (9 tracked)
Surprise! Japan April 20-Day Trade Deficit is Yn878bn Only
o Deficit Shrinks Yn273bn yoy
o Exports +3.9% yoy, with Monthly Movt 0.2SDs Above Historic Seasonal Trends
Shock! Imports Shock, Down 1.2% yoy, with Monthly Movt 1.1SDs Below Historic Seasonal Trends