
China's 2025, No Solutions
Let's be honest, there's no good news from China's economy

We’re not going to be seeing significant data out of China now until late March, so with the release of December and 4Q’s data its time to take a look before . So although there may not be anything particularly stunning in the data, economic hygiene dictates that we’re got to deal with it.
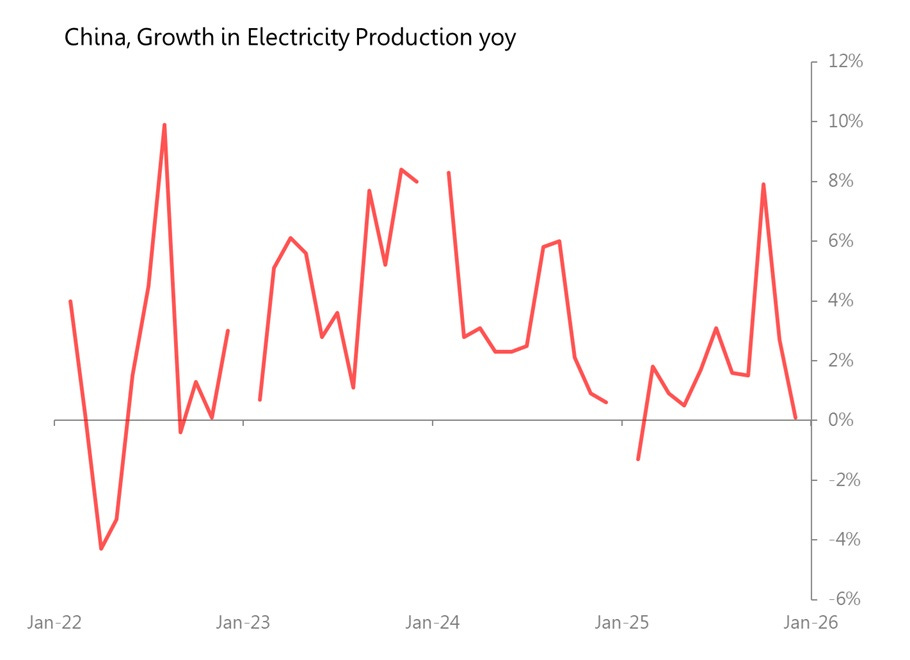
The data is underwhelming. Given the difficulties of China’s economic data, it used to be that Chinese leaders looked at two data-points in particular to assess real conditions: electricity production and freight volumes. Here’s what they look like;
And freight:
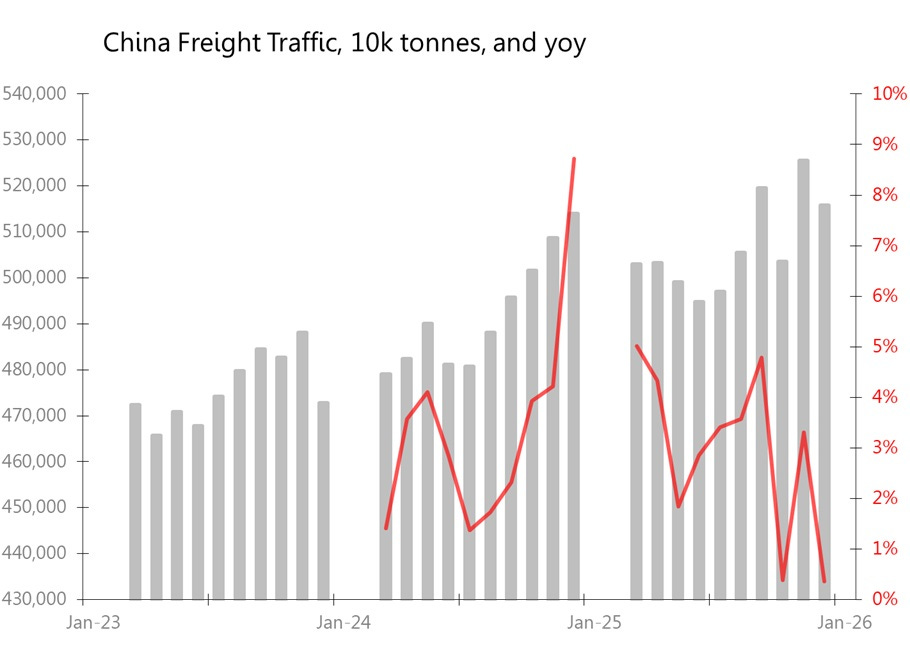
To summarise:
Electricity production rose only 0.1% yoy in December, and rose 3.6% yoy in 4Q, (up from 2.1% in 3Q);
Freight volumes were up 0.4% yoy in December, and rose 1.4% in 4Q (down from 3.9% in 3Q).
On these metrics, December was a very weak month, but in quarterly terms, 4Q was probably little changed from 3Q.
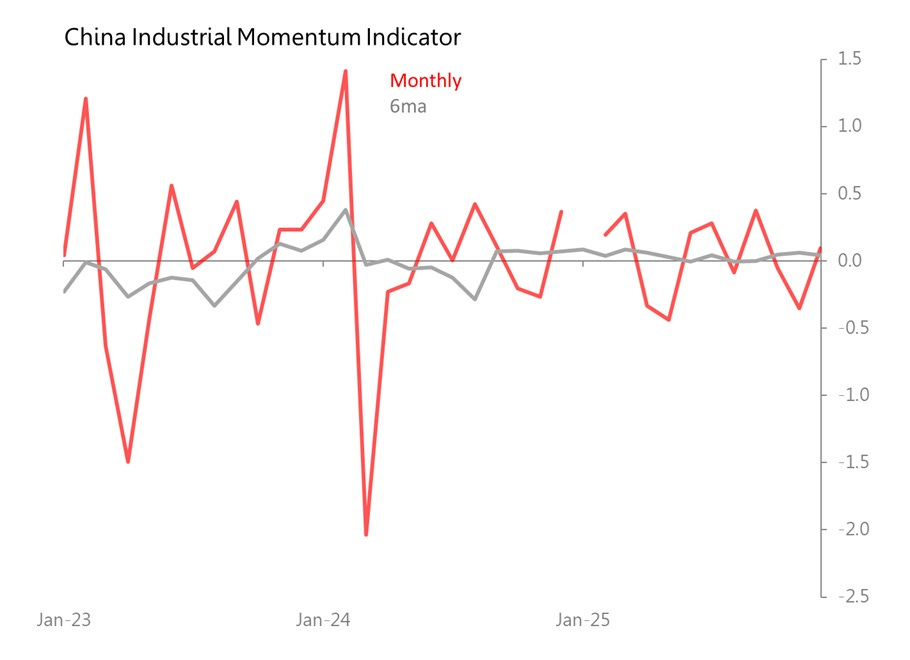
More broadly, I build three momentum indicators to measure breaks against 5yr trends: industrial momentum, domestic demand momentum, and monetary conditions.
Industrial momentum takes into account industrial production, electricity production and exports. Industrial production rose 5.2% yoy with a monthly movt 0.5SDs above trend; electricity production rose 0.1% yoy and was 0.9SDs below trend, whilst exports rose 6.6% and were 0.7SDs above trend. Result: industrial momentum indicator was 0.1SDs above trend, and its 6ma was flat.
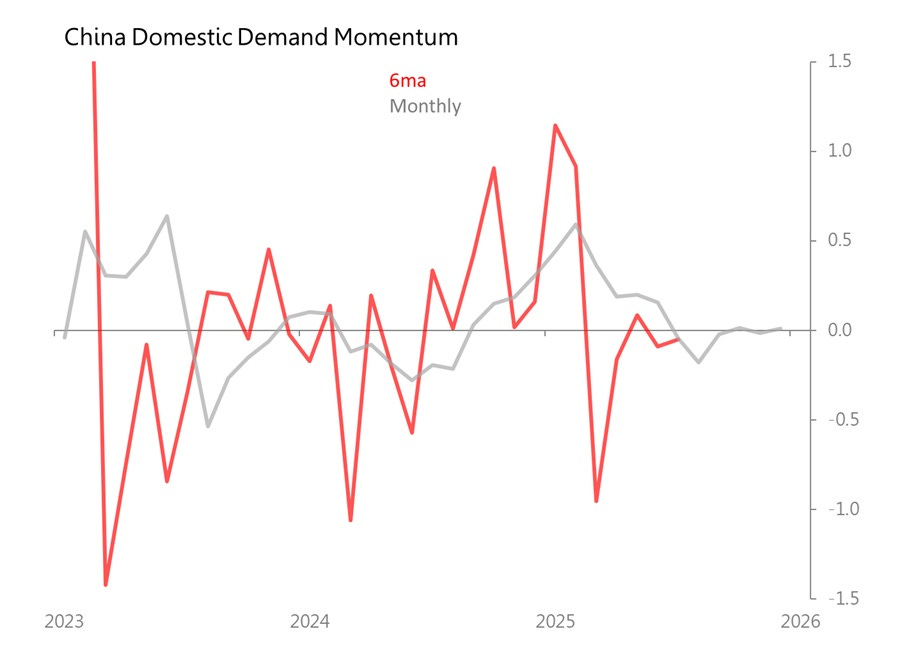
My domestic demand momentum indicator takes in data for retail sales, auto sales, PMI payrolls, and the Real Estate Climate Index. In December:
Retail sales value rose only 0.9% yoy, with a monthly movt in-line with historic trends;
Auto sales fell 6.3% yoy, with a monthly movt 0.3SDs below trend;
The CFLP’s combined manufacturing and services PMI payrolls indexes rose 0.8ppt to 46.1, which was 1.1SDs above the trend since 2023.
The Real Estate climate index fell 1.2% yoy with a 0.5% mom fall which was 0.7SDs below trend.
Result: for December, momentum was absolutely in-line with established trends; so was the 6m momentum line. In short, there is no positive or negative development, China’s domestic economy is simply running on trend, and those underlying trends are themselves mildly negative. It has been that way repeatedly since September.
And finally, the modest attempts to engineer a recovery through monetary policy, which never looked stronger than half-hearted, look to have peaked in mid-2025, and are now not so much in retreat as lapsing back to normal.
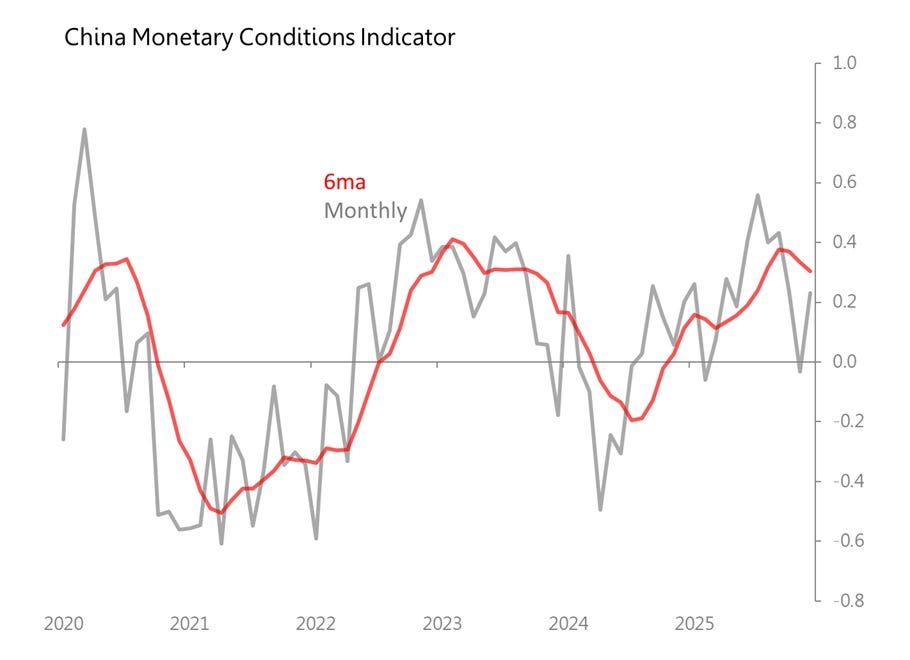
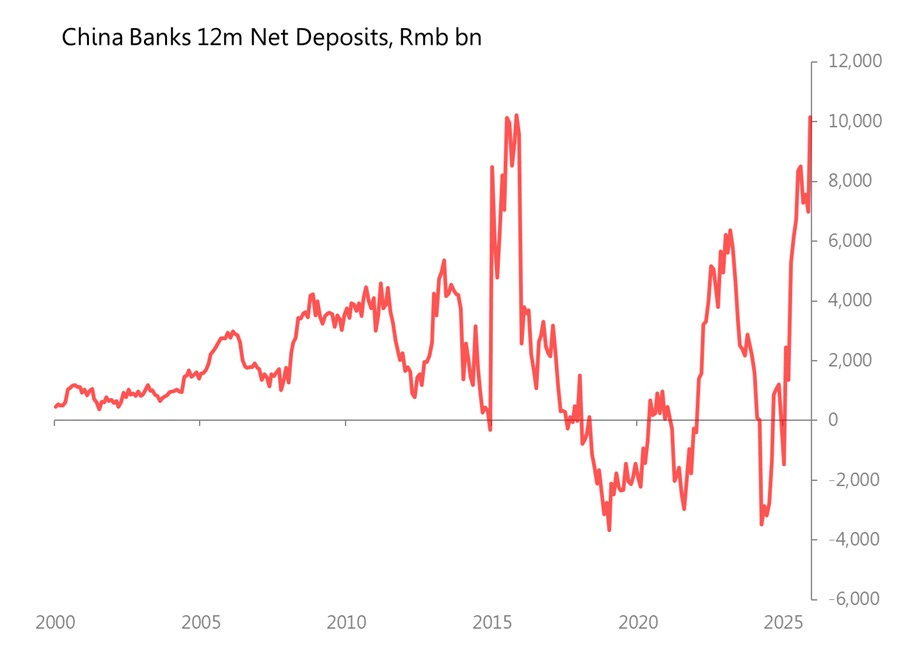
These efforts, as we can see from the momentum indicators for both the industrial economy and domestic demand, have not managed to stimulate the economy effectively. Why not? Essentially because China is genuinely caught in a liquidity trap: in December, loan growth slowed to 6.3% yoy with a monthly movt 0.5SDs below trend, whilst deposits rose 8.7% yoy and were 1.1SDs above trend. Liquidity preference (M1/M2) represents essentially current expected demand for money to buy goods, services, investments. In December 2025 it stood at 33.9%, down from 35.5% in December 2024. Or look at it another way: China’s banks had net deposit inflows amounting to Rmb10.16 in 2025, compared with a net deposit outflow or Rmb100bn in 2024.
In these monetary circumstances, loosening monetary policy further is, indeed, ‘pushing on a piece of string’.
The fundamental truth remains that China’s economic problems will not, and cannot, be solved by revivifying the real estate market, because the real estate market’s massive problem of oversupply merely represents the tip of the iceberg of toxic local government financial dodges improvised to cover the underlying gross mismatch between their ambitions (all that infrastructure) and their tax revenues.
What matters now is to make sure that that infrastructure can pay for itself. . . .
So, here are a final couple of metrics which bear directly on that question. First, capacity utilization rate in 4Q was put at 74.9%, down from 76.2% in 4Q04; on a 12m basis, capacity utilization averaged 74.4% in 2025, down from 75% in 2024. And second, asset turns, derived from the monthly industrial profits series, came to 0.74x i 2025, down from 0.77x in 2024. Or, to put it another way, all that infrastructure spending found it more difficult to pay its way in 2025 than in 2024.
I’d love to be wrong about China, but . . .